

AllureレポートのTips色々

はじめに
どうも、こんにちはテスト自動化アーキテクトの森川です。
Allureは多くの言語に対応したOSSの美しいテストレポートフレームワークです。
テストスクリプトのカスタマイズが多少必要とはいえ、多機能なレポートを提供してくれるので今でも固定ファンが多いと(私は)思っています。
今回はコマンドラインを中心に少々込み入ったTipsまでをご紹介。
前回のエントリー:自動テストのレポートツールAllure ReportのTips少々
コマンドラインで叩く
allureコマンドラインはインストール可能ですが、gradleプロジェクトであれば .allure/allure-x.x.x/binにロードされているので、こちらを直接叩くことができます。
ためしに--helpしてみましょう
$ .allure/allure-x.x.x/bin/allure --help
(...)
  Commands:
    generate      Generate the report
      Usage: generate [options] The directories with allure results
        Options:
          -c, --clean
            Clean Allure report directory before generating a new one.
            Default: false
          --config
            Allure commandline config path. If specified overrides values from
            --profile and --configDirectory.
          --configDirectory
            Allure commandline configurations directory. By default uses
            ALLURE_HOME directory.
          --profile
            Allure commandline configuration profile.
          -o, --report-dir, --output
            The directory to generate Allure report into.
            Default: allure-report

    serve      Serve the report
      Usage: serve [options] The directories with allure results
        Options:
          --config
            Allure commandline config path. If specified overrides values from
            --profile and --configDirectory.
          --configDirectory
            Allure commandline configurations directory. By default uses
            ALLURE_HOME directory.
          -h, --host
            This host will be used to start web server for the report.
          -p, --port
            This port will be used to start web server for the report.
            Default: 0
          --profile
            Allure commandline configuration profile.

    open      Open generated report
      Usage: open [options] The report directory
        Options:
          -h, --host
            This host will be used to start web server for the report.
          -p, --port
            This port will be used to start web server for the report.
            Default: 0

    plugin      Generate the report
      Usage: plugin [options]
        Options:
          --config
            Allure commandline config path. If specified overrides values from
            --profile and --configDirectory.
          --configDirectory
            Allure commandline configurations directory. By default uses
            ALLURE_HOME directory.
          --profile
            Allure commandline configuration profile.
open / レポートの閲覧
ローカル環境で閲覧するにはブラウザの起動オプションが必要ですが、一時的なサーバを起動して閲覧することもできます。
allure open build/reports/allure-report --host 127.0.0.1 --port 8888
ブラウザが起動するのは楽で良いですが、オプションで起動するのと、どちらが楽と思うかは皆さん次第ですね。
serveコマンドと似ていますが、こちらはレポートを開くだけ。
serveコマンドではallure-resultsからレポートを生成します。
generate / レポートのマージ
generateコマンドはallure-resultsからレポートを生成します。
複数指定することでマージできます。
allure genereate -c {path1} {path2} -o output-path
マージできるレポートの上限は不明ですが、相当数を指定できるみたいです。
他の方法でマージするのは難しそう
他の方法としてはcオプションを外せばレポートを追加作成できそうですが、the report is already in useとエラーになるので実行不可です。
一つのディレクトリに複数のallure-resultsファイル(Json)をぶち込んでしまうことも考えてみましたが、categories.jsonやexecutor.jsonは固定ファイル名なので上書きされてしまいます。
また、多階層をパースしてくれるわけではないのでこの案は難しそうです。
履歴の保持
AllureのCIプラグインでは自動的に履歴を保持してくれますが、それができない場合は以下の手順で行います。
前回レポートのallure-report/historyディレクトリをフォルダごと今回実行したallure-resultsディレクトリにコピー
allure generateコマンドでレポート生成
historyに出力される内容はlocal実行時と各種プラグインでは多少違いがあります。
ローカル実行時(history.json)
"items" : [ {
      "uid" : "e3e721517e41902b",
      "status" : "passed",
      "time" : {
        "start" : 1657550924034,
        "stop" : 1657550925786,
        "duration" : 1752
      }
    } ]
  },
Jenkins-Allureプラグイン実行時(history.json)
"items" : [ {
      "uid" : "1e67247d9f88b9df",
      "reportUrl" : "http://my-jenkins/job/job-name/job/test/1/allure/#testresult/1e67247d9f88b9df", 👈これ
      "status" : "passed",
      "time" : {
        "start" : 1657522757398,
        "stop" : 1657522757449,
        "duration" : 51
      }
    }
プラグインではレポートURLが出力されます。つまり過去のレポートへ飛べるということですね。
これはアドバンテージです。
動的に生成されるテストをマージするとレポート出力されない件
JUnit5のTestFactoryなどを用いて動的にテストケースを作成する場合、レポートマージ時に独特な挙動をする場合があります。
動的生成して実行されたテストがレポートの左ペインに1つしか表示されないという事象です。
残りのテストはどこにいったのかと探すと、右ペインのタブ"再実行(Retry)"にすべてまとまって表示されています。
どうやらAllureがレポート生成時に同一テストとみなしてリトライ扱いにしてしまっているようです。
対処はgradleタスクで
詳細は後述しますが、historyIdがテストクラス間で重複しているためでした。
暫定的な対策としては少々強引ですがgradle taskで手を打ちました。
実装は下記のとおりで、historyIdが重複しないようにテストクラス名(動的に生成される一意なテスト名)を付与して、*-result.json を再出力しています。
def resultJson = fileTree(dir: 'build/allure-results', include: '**/*-result.json')
resultJson.each {
    def path = it.getAbsolutePath()
    def content = it.getText('UTF-8')
    def json = new JsonSlurper().parseText(content)
    // テストクラス名
    def className = json.name.replaceFirst('compareAll: ','')
    def historyId = json.historyId
    // history idにクラス名を付与して一意に
    json.historyId = historyId + '-' + className
    def json_str = JsonOutput.toJson(json)
    // Jsonファイル置き換え
    def json_beauty = JsonOutput.prettyPrint(json_str)
    it.delete()
    new File(path).write(json_beauty)
}
ご覧の通り、良案とは言えないので、根本的な解決策をおわかりになれば、是非ともコメントください。
原因を調べてみると
テストクラスのレポート情報を格納する *-result.jsonではhistoryIdをよりどころにしており、同一であればリトライと判断されるようです。
~_result.json
"historyId": "8a13f2f2c62ec51568cad2b8b4efd3bs",
historyIdはjunit-platform-launche APIで生成しており、その中身はテストエンジンと対象クラス情報を連結した文字列のMD5です。
つまるところ、テストクラスをあらわす固有識別子なわけですから、動的テストを展開しても当然常に同じ値になります。
このためマージ時には同じテストケースとして判断されていました。
// junit-platform-launcher
org/junit/platform/launcher/TestIdentifier.java

String uniqueId = testDescriptor.getUniqueId();
引用元: junit5/TestIdentifier.java at main · junit-team/junit5
プラグイン
Allureレポートは様々な言語のテストツールに適用できます。
Java: JUnit4,JUnit5、TestNG
JS: Jest、Mocha、Jasmin、Karma
Ruby: Cucumber、RSpec
.Net: SpecFlow、NUnit 3、NUnit 2、MSTest
PHP: PHPUnit
Python: PyTest、Behave、Nose
Scala: ScalaTest、Specs
E2E: Cypress、Selenide、Playwright
Integrtation: Jenkins、TeamCity、Bamboo、Codefresh、Gradle、Maven
プラグインとして構成されており、そこがAllure Frameworkと呼称される所以だと思います。
ロゴのカスタマイズ
custom-logo-pluginはロゴをカスタマイズします。
ロゴイメージを置いてconfigファイル(allure.yml)にプラグイン名を追記することで利用可能です。
イメージ差分をレポーティングするscreen diffプラグイン
ユニークなプラグインがありました。
スクリーンショットの比較時にレポートアレンジをしてくれます。
まずレポートには差分イメージが表示されます。
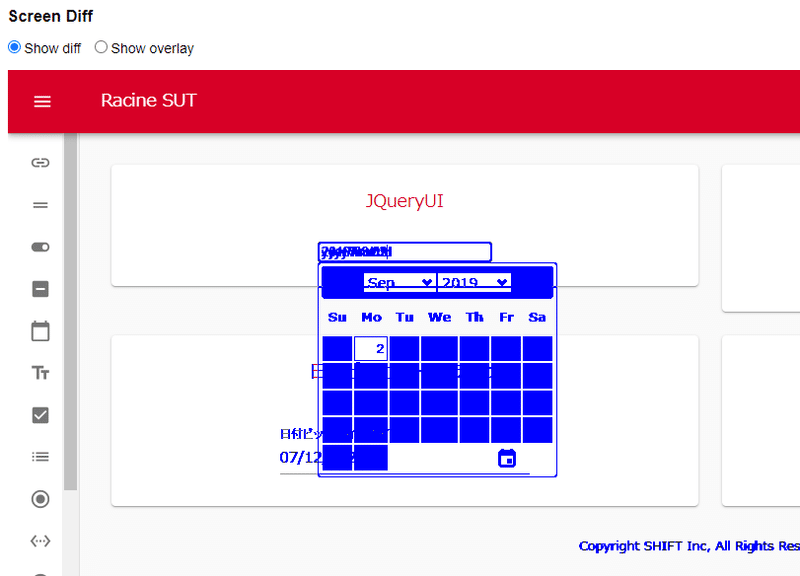
※ 青色が差分です。
Show overlayを選択するとカーソルにあわせて期待値と実行時のイメージがマウスに沿って切り替わります。
画像差分を見るときに重宝しそうですね。
サンプルコードはこちらです。
@Test
void screenshotDiff() {
    Allure.label("testType", "screenshotDiff"); // 👈 labelづけ
    open(url);
    final String dateInputText = "2022/09/02";
    BufferedImage oldImage = ImageUtils.getScreenshot(false);
    $("#element-id").setValue(dateInputText).pressEnter();
    BufferedImage newImage = ImageUtils.getScreenshot(false);

    attachScreenshot(oldImage,"expected"); // 👈 イメージ名をアタッチ
    attachScreenshot(newImage,"actual");
    attachScreenshot(new ImageDiffer().makeDiff(oldImage, newImage).getMarkedImage(),"diff");
}
Labelとスクリーンショットのファイル名を指定するだけで画像比較ブロックをレポートに挿入してくれます。
allure2/README.md at master · allure-framework/allure2
以上、AllureレポートのTipsでした。
それではみなさん、楽しい自動テストライフを!
執筆者プロフィール:森川 知雄
中堅SIerでテスト管理と業務ツール、テスト自動化ツール開発を10数年経験。
SHIFTでは、GUIテストの自動化ツールRacine(ラシーヌ)の開発を担当。
GUIテストに限らず、なんでも自動化することを好むが、ルンバが掃除しているところを眺めるのは好まないタイプ。
さまざま案件で自動化、効率化によるお客様への価値創出を日々模索している。2021年からは技術イベントSHIFT EVOLVEの運営を主担当。
司会は大の苦手。
お問合せはお気軽に
https://service.shiftinc.jp/contact/
SHIFTについて(コーポレートサイト)
https://www.shiftinc.jp/
SHIFTのサービスについて(サービスサイト)
https://service.shiftinc.jp/
SHIFTの導入事例
https://service.shiftinc.jp/case/
お役立ち資料はこちら
https://service.shiftinc.jp/resources/
SHIFTの採用情報はこちら
https://recruit.shiftinc.jp/career/